Visual Data is the basis for new business insights
High resolution videos and images collected from drones, IoT sensors, fixed cameras, mobile devices, and other sources like LiDAR, and Thermal cameras can all lead to new business insights when used effectively. There is rich information in these videos and images as well as in the metadata associated with them. When this visual data is effectively transformed, correlated, and analyzed it serves as the basis for significant business breakthroughs.
Enterprises need to make the most of their visual data, enabling collaboration by key stakeholders in the organization, resulting in the data being visualized through various image modeling tools and Artificial Intelligence enabling new business insights. Many companies are using visual data like never before to achieve breakthroughs in safety, inspection, maintenance and transforming the way their businesses operate.
We will explore some keys to unlocking the power of visual data when these elements are brought together into a unified workflow, creating a “single pane of glass” through which the entire data visualization process accelerates business outcomes.
Visual Data is the new Soil
You may have heard the term popularized lately “Data is the new oil” . Originally coined in 2006 by mathematician Clive Humby, the term recently picked up more steam after the Economist published a 2017 titled “The world’s most valuable resource is no longer oil, but data”. Since then many have used the term to describe the importance of data.
As information becomes increasingly visual, David McCandless adapted this metaphor to ”Visual data is the new Soil” in his TED Talk on data visualization. Visual data has become a fertile medium, that when properly cultivated, provides unprecedented information and insights from data.
One of the challenges with visual data is that it is difficult to work with and act on. The data is often very large and requires specialized tools to view the data. For example, an inspection project may contain a wide range of visual information that can include thousands of hi-resolution images, hours of 4K video, large 3D models, and detailed Orthomosaic maps that provide critical information about the asset.
Today, organizations largely rely on disjointed point tools and swivel chair approach to view and make decisions on that visual data. But using point tools does not allow users to see the relationships and context between the data. Organizations lose valuable information and possibly miss critical issues.
Organizations want a single immersive way to visualize, analyze, and provide in-depth analysis. In other words, a unified data visualization platform that seamlessly orchestrates all this data into what we call a “single pane of glass”.
Data Visualization platform to accelerate digital transformation
Let’s explore the key capabilities leveraging the power of visual data across the organization.

Integrated data viewers
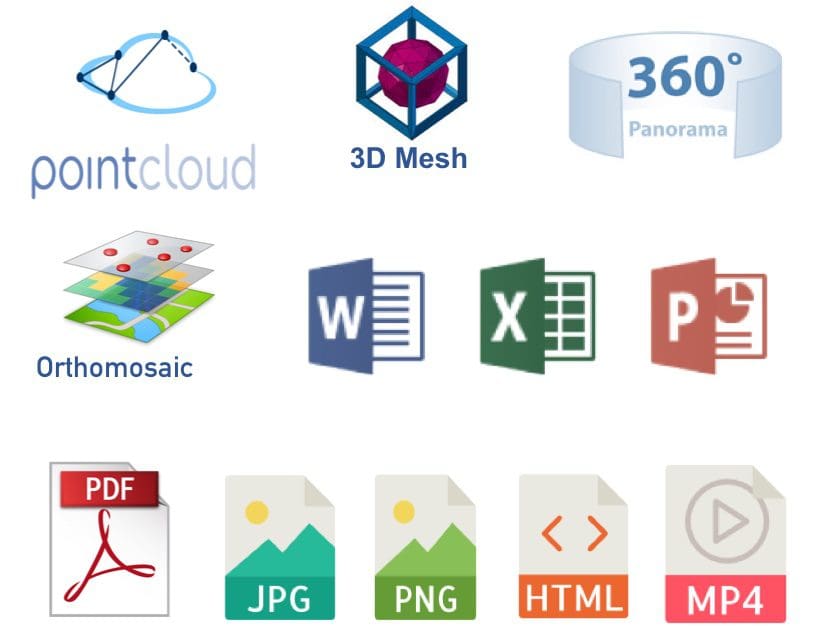
Visual data covers a wide spectrum of formats. A visualization solution should allow users to seamlessly access and view as many formats as possible from a single platform. These might include:
-
- Hi-resolution images
- 4K videos
- Point Clouds and 3D Mesh
- Orthomosaic maps
- Panoramas
- Productivity documents such as PDFs, Word, Excel, PowerPoint
- Thermal and multi-spectral imagery

Annotate, Tag, and Enrich visual data.
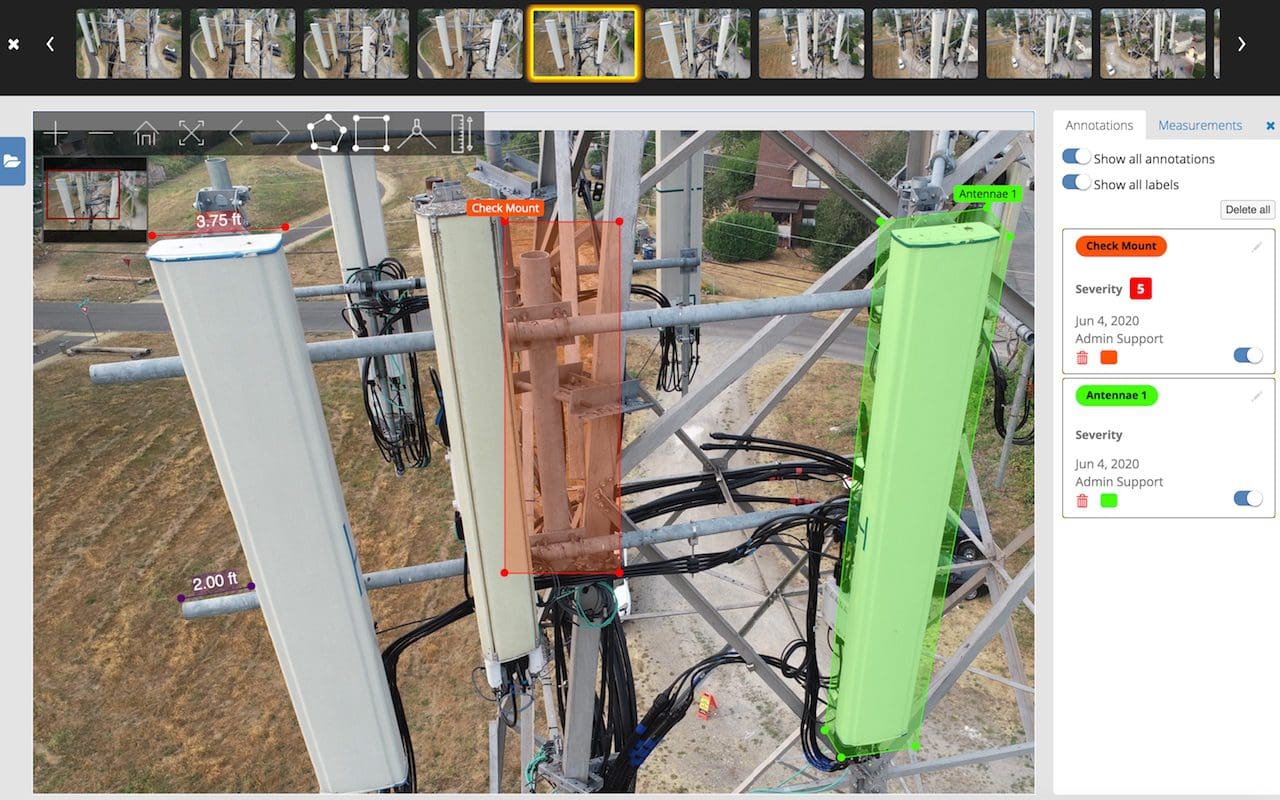
Often times stakeholders need to add additional information, tag, and annotate on any visual data format. This means providing a robust suite of tools to tag and annotate any type of visual data such as images, videos, panoramas, and 3D models. This allows the data to get enriched over time that can lead to quicker issue detection, remediation, and collaboration.

Harness the power of geo-visual data
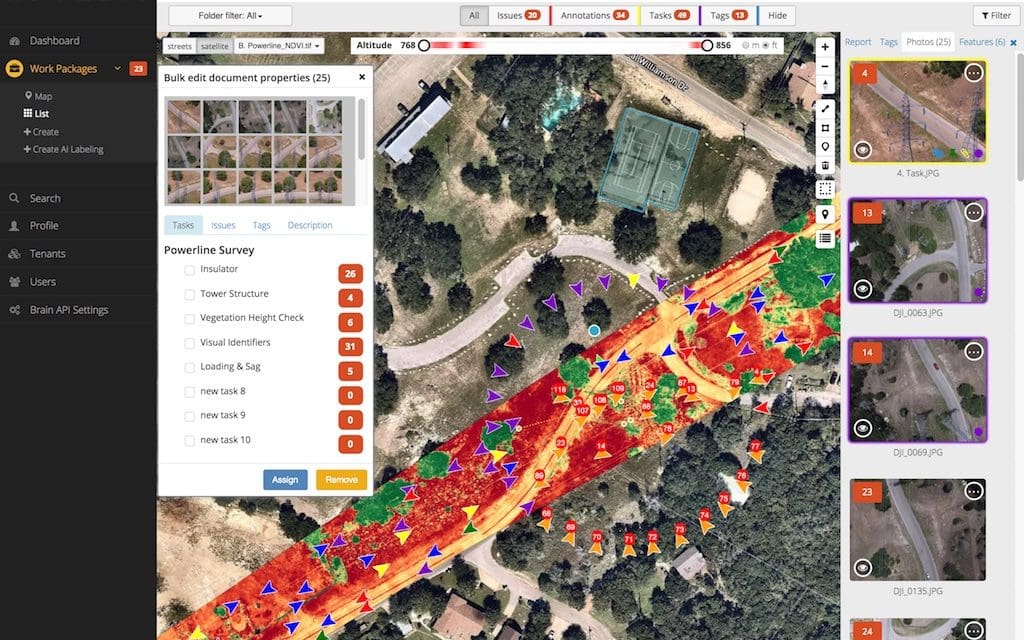
Visual data often also contains rich metadata such as GPS locations, EXIF, and other valuable information. The system should automatically extract that geo-visual data, including Orthomosaic map to provide rich geo-spatial context. In addition, geo-visual tools such to measure, compare, and overlay data over time enables deeper insights and accelerates business decisions.

View and interrogate 3D Reality Models
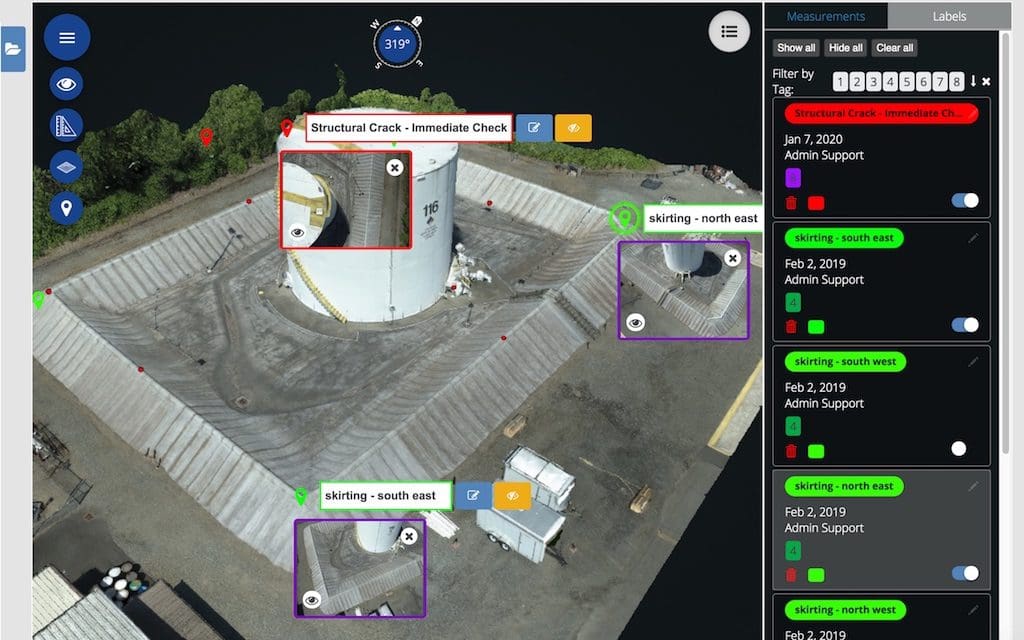
Many organizations utilize 3D Point Cloud models, generated from the collected imagery to provide a detailed reality model or “digital inspection twin” of the assets.
The ability to manage, view, and interrogate these models alongside all the other visual data is critical to delivering insights. In addition, the platform should provide tools such as performing measurements, tag, annotate, and embed any type of documents including images and videos on the 3D models for added clarity.

Search, Filter, and Dashboards
It is critical that the visual information is easily searchable and shareable throughout the organization.
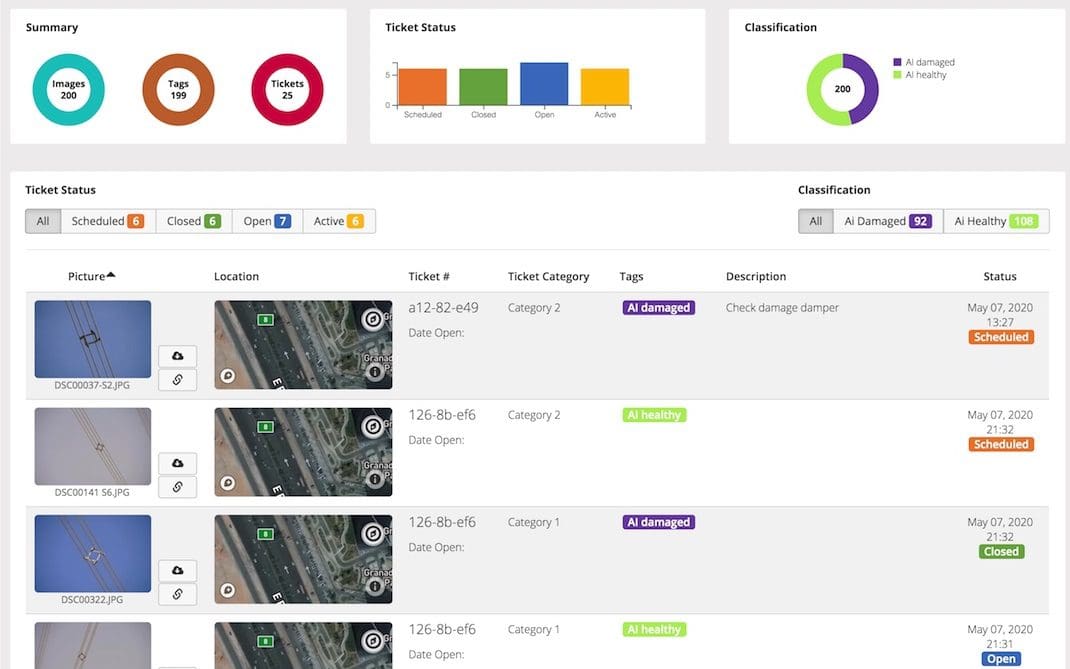
The data visualization platform should provide a robust set of tools allowing users to easily filter on metadata such as tags and annotations. The data should also be integrated into workflows such as ticketing to allow for quick anomaly remediation.
.
SUMMARY
In summary, a comprehensive data visualization platform gives organizations a single source of truth, empowering stakeholders to reason over the data without having to move that data.
We call this knowledge compression. We are able to effectively squeeze a huge amount of information into an immersive and orchestrated space to deliver these insights. What normally takes days or weeks to stitch together with disparate systems, organizations can now deliver in seconds through a unified digital data model and presented in a single pane of glass.
Contact us at info@optelos.com and let us help you start your digital transformation journey and see how you can realize significant cost savings in your asset management programs.
